


The National Hurricane Center is updating, or continuing to use changes to, its graphic products and services. Here’s what’s to look forward to if Florida is threatened by another storm this year:
The Experimental Cone Graphic with a depiction of inland watches and warnings for the United States returns: The NHC will again issue an experimental version of the cone graphic that includes a depiction of inland tropical storm and hurricane watches and warnings in effect for the continental United States. Based on feedback received during the 2024 hurricane season, the experimental cone graphic will be available on hurricanes.gov for full and intermediate advisories. The current cone graphic will continue to be available, and there will be no changes with respect to how watches and warnings are displayed on that graphic (i.e., only coastal watches/warnings will be depicted). Recommendations from social science research suggest that the addition of inland watches and warnings to the cone graphic will help communicate wind risk during tropical cyclone events.
The experimental graphic may not be available as soon as the current cone graphic due to the time needed to compile complete inland watch and warning information, but it should generally be available
within 30 minutes of the advisory release.
Rip Current Risk Map for active tropical cyclones
During the past decade there has been an increase in surf and rip current fatalities in the United States. Many of these fatalities occur when swells from distant hurricanes cause dangerous surf and rip current conditions along the U.S. coastline. In order to better highlight the risk of these dangerous conditions, NHC will provide rip current risk information that originates from local National Weather Service (NWS) Weather Forecast Offices in a national rip current risk map when at least one active tropical system is present. This national risk map is designed for beach goers to easily view, on one webpage, rip current risk. The rip current risk will be provided for the current day, the next day, and as a composite showing the highest risk over both days for areas along the East and Gulf coasts of the United States, Puerto Rico and the U.S. Virgin Islands, and the coast of southern California. Note that this map will provide rip current risk information but will not provide specific information on height of the surf.
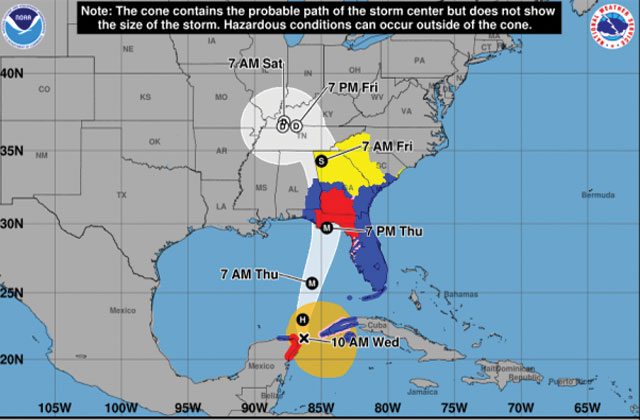
Annual update to the track forecast error cone
it’s smaller: The size of the tropical cyclone track forecast error cone for the Atlantic basin in 2025 will be about 3–5% smaller as compared to 2024. The cone represents the probable track of the center of a tropical cyclone, and is formed by enclosing the area swept out by a set of imaginary circles placed along the forecast track (at 12, 24, 36 hours, etc.). The size of each circle is set so that two-thirds of historical official forecast errors over the previous five years fall within the circle.
Information provided by the National Hurricane Center (hurricanes.gov).